中国科技论文统计源期刊 中文核心期刊  
美国《化学文摘》《国际药学文摘》
《乌利希期刊指南》
WHO《西太平洋地区医学索引》来源期刊  
日本科学技术振兴机构数据库(JST)
第七届湖北十大名刊提名奖  
医药导报, 2021, 40(4): 525-529
doi: 10.3870/j.issn.1004-0781.2021.04.018
基于间断时间序列分析重点监控药品管控措施对合理用药的影响
Impact of Key Monitoring Drug Management Measures on the Rational Drug Use——Analysis Based on Interrupted Time Series
马晓华, 鲁憬莉, 康建, 杜书章, 张晓坚

摘要:

目的 评估重点监控药品管控措施对合理用药的影响,为完善和推进重点监控药品政策提供依据。方法 收集2017年1月—2018年12月郑州大学第一附属医院药品使用数据,结合处方点评,采用间断时间序列(ITS)设计,运用分段回归分析(Segmented regression analysis)模型,以全部重点监控药品的使用频度(DDDs)、使用金额占比和处方合格率为观测指标,分析实施重点监控药品管控措施前后重点监控药品的使用量和使用合理性的变化。结果 实施重点监控药品管控措施后,监控药品的使用频度和使用金额占比均由增长转为下降趋势,且差异有统计学意义(斜率=-15 774.78,P=0.003;斜率=-0.005 119 5,P=0.000)。点评药物的处方合格率显著提高(P=0.009),呈升高趋势且差异有统计学意义(斜率=0.009 299 2,P=0.000)。结论 实施重点监控药品管控措施有效降低了监控药品的使用量,提高了监控药品的用药合理性。

关键词: 重点监控药品 ; 合理用药 ; 间断时间序列分析 ; 处方点评

Abstract:

Objective To evaluate the impact of key monitoring drug management on the consumption and rational use of drugs,and to provide a basis to promote and improve key monitoring drugs management policy. Methods Data regarding DDDs and consumption proportion of key monitored drugs in our hospital from January 2017 to December 2018 were collected.Combining with comments on prescription,we assessed trends of consumption and rationality of key monitored drugs by using an interrupted time series design and segmented regression analysis. Results After the management implementation,the significant downward trends of DDDs and consumption proportion in key monitored drugs were observed (slope:-15 774.78,P=0.003;slope:-0.005 119 5,P=0.000).The rates of qualified prescriptions were significantly increased (P=0.009) with statistic difference in upward trend (slope: 0.009 299 2,P=0.000). Conclusion Key monitoring drugs management significantly reduced the use of monitored drugs and promoted the rational use of drugs in the monitoring catalog.

Key words: Key monitoring drug ; Rational use of drug ; Interrupted time series ; Prescription comment

开放科学(资源服务)标识码(OSID)

随着我国医药卫生体制改革的深入推进,医疗费用不合理增长问题愈加突出,部分价格高、辅助治疗性药物过度使用现象受到社会各界的广泛关注和重视。2015 年2 月国务院办公厅发布的《关于落实完善公立医院药物集中采购工作指导意见》( 国卫药政发[2015]70 号),以及2015年11 月国家卫生计生委、国家发展改革委、财政部、人力资源社会保障部和国家中医药管理局制定的《关于控制公立医院医疗费用不合理增长的若干意见》( 国卫医发[2015]89 号) 中均明确提出,医疗机构应明确需要重点监控的药品品规数,进行重点监控。随后,安徽省、北京市、云南省和四川省等多地相继公布并实施了重点监控药品管理政策[1]。2017年12月河南省卫生计生委会发布了《关于进一步加强医疗机构辅助用药重点监控工作的通知》(豫卫医〔2017〕69号),根据文件要求我院于2018年1月正式开展重点监控药品管理工作。

各地医疗机构重点监控药品的管理措施[2,3]虽然各有不同,但重点监控的目标是一致的即合理用药,笔者尚未见有文献就重点监控对合理用药的影响进行分析研究。间断时间序列(interrupted time series,ITS)研究是收集干预前后多个时间点的观察指标,运用适当的统计分析模型比较干预实施前后相关指标的趋势变化和水平变化来评估干预对指标的影响[4],是评估政策措施纵向成效最强的一种准实验设计。本研究采用间断时间序列设计,通过分析实施重点监控药品政策前后监控药品使用频度、金额占比和处方合格率的变化,以评估重点监控药品管控措施对监控药品使用量和合理用药的影响,以期为完善和推进重点监控药品政策提供依据。

1 资料与方法
1.1 研究设计

采用简单型间断时间序列准试验设计。以我院重点监控药品政策实施时间2018年1月为干预点,按月收集干预前(2017年1月—2017年12月)和干预后(2018年1月—2018年12月)各观测点的指标结果。满足间断时间序列干预措施实施前后至少有12个观测点的要求[5]

1.2 干预措施

根据《关于进一步加强医疗机构辅助用药重点监控工作的通知》(豫卫医〔2017〕69号)制定发布了我院重点监控药品目录和重点监控工作实施方案。①目录施行动态管理,第一批目录包括神经节苷脂、脑苷肌肽、鼠神经生长因子、小牛血去蛋白提取物、磷酸肌酸、核糖核酸、前列地尔等31个品种;②对目录内药品的使用情况进行实时监测,对临床各科室重点监控药品的使用量、使用金额等情况进行排名并予以公示;③设置预警标准,对达到预警标准的药品限制使用,并对其供应商进行约谈;④对目录内药品进行处方点评,点评结果全院通报;⑤制定重点监控药品院内使用规范;⑥依托院内网络开发搭建药事管理综合平台,使各干预措施标准化、流程化。总之,构建了由“医”——医生、医务处,“药”——药师、药学部,“护”——护士、护理部以及纪检等多方参与联动协作的立体化管控措施体系。

1.3 指标数据提取

通过我院HIS系统收集2017年1月—2018年12月每月药品使用金额及数量。以全部重点监控药品金额占比和用药频度作为指标评,计算公式:重点监控药品金额占比=重点监控药品金额÷全院药品总金额×100%,用药频度(defined daily doses,DDDs)=药品消耗量÷DDD值。其中药品DDD值通过世界卫生组织药物统计方法合作中心ATC/DDD Index 在线系统[6]查得,若未收录则以第17 版《新编药物学》[7]为基准结合临床用药实际情况和药品说明书推荐的成人常规日剂量确定。

以处方合格率作为评估重点监控药品政策对合理用药影响的指标。通过合理用药软件系统(PASS)每月系统随机提取10%的出院病例进行点评。点评药物为2017年度重点监控药品中使用金额最大的药物,包括神经节苷脂针和磷酸肌酸针。点评依据为药品说明书和《医院处方点评管理规范(试行)》(卫医管发〔2010〕28 号),处方合格率=合理处方例数÷点评处方总例数×100%。

1.4 统计分析

间断时间序列分析常用的模型有自回归积分滑动平均模型(Autoregressive integrated moving average,ARIMA)和分段回归分析(Segmented regression analysis)[8],因具有需要的数据采集点少、建模简单易操作等优势,分段回归分析模型在政策实施效果的研究中应用更为广泛。本研究在间断时间序列设计方案的基础上,运用分段回归分析,回归模型设定如下:

Y01×time+β2×intervention+β3×time after intervention+ε其中y为各观测指标,包括重点监控药品金额占比、用药频度和处方合格率,β0为观测指标的基线水平,β1为干预前观测指标的变化趋势,β2为干预后量的改变,β3为干预后趋势的改变,β13为干预后的趋势。time为连续变量取值1~24,intervention为二分类变量取值为0/1,干预前为0干预后为1,time after intervention为连续变量,干预前取值0,干预后取值1~12,ε为误差项。整个分析由Stata14.0统计分析软件实现。

2 结果
2.1 重点监控药品政策对目录内药品使用量的影响

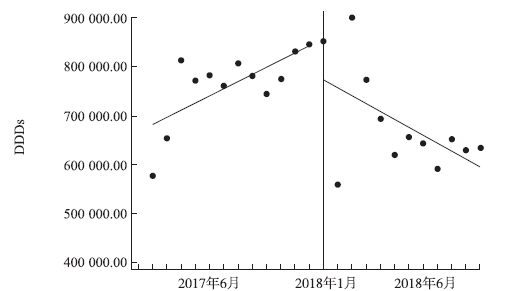
对重点监控药品的使用频度进行统计分析,结果见表1和图1。结果表明:①实施重点监控政策干预前目录内药品的使用量呈增长态势,且差异有统计学意义(β1=14 633.01,P=0.033);②实施重点监控政策干预当月,目录内药品的使用频度有所下降,但不具有统计学意义(β2=-56 348.26,P=0.380);③实施重点监控政策干预后,目录内药品的使用频度呈现下降趋势,且差异有统计学意义(β13=-15 774.78,P=0.003)。

表1 重点监控药品政策对各观测指标的影响
Tab.1 Effect of key monitoring drugs policy on the indexes
指标 β1 β2 β3
系数 P 系数 P 系数 P
DDDs 14 633.01 0.033 -56 348.26 0.380 -30 407.79 0.003
重点监控药品金额占比 0.001 090 7 0.060 -0.031 404 2 0.000 -0.006 210 2 0.000
处方合格率 -0.003 314 7 0.053 0.045 766 0.009 0.012 613 9 0.000

表1 重点监控药品政策对各观测指标的影响

Tab.1 Effect of key monitoring drugs policy on the indexes

图1 重点监控实施前后目录内药品使用频度的变化

Fig.1 Change of DDDs of the drugs in catalogue before and after applying key monitoring policy

2.2 重点监控药品政策对目录内药品使用金额占比的影响

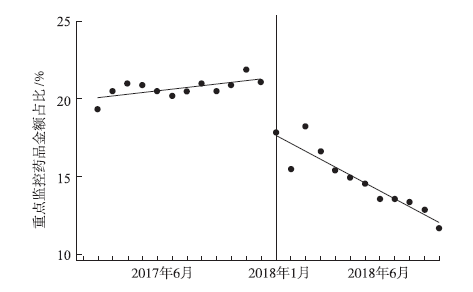
对重点监控药品的使用金额占比进行统计分析,结果见表1和图2。结果表明:①实施重点监控政策干预前重点监控药品使用金额占比呈增长趋势,但差异无统计学意义(β1=0.001 090 7,P=0.060);②实施重点监控政策干预当月,重点监控药品使用金额占比显著下降(β2=-0.031 404 2,P=0.000);③实施重点监控政策干预后,重点监控药品使用金额占比呈现下降趋势,且差异有统计学意义(β13=-0.005 119 5,P=0.000)。

图2 重点监控实施前后目录内药品使用金额占比的变化

Fig.2 Change of the sum proportion of the drugs in catalogue before and after applying key monitoring policy

2.3 处方点评结果

对神经节苷脂针和磷酸肌酸针的使用进行点评,结果见表2和表3。由表可见,实施重点监控政策后平均问题处方例数由233.42降为96.83,平均处方合格率由83.82%提高到92.62%。实施重点监控政策前存在的不合理用药问题为适应证不适宜(平均占比51.82%)、用法用量不适宜(平均占比13.67%)、适应证和用法用量均不适宜(平均占比30.09%)、重复用药问题(平均占比4.42%)。实施重点监控政策后适应证不适宜(平均占比37.20%)、用法用量不适宜(平均占比42.50%)、适应证和用法用量均不适宜(平均占比18.14%)、重复用药问题(平均占比2.16%)。

表2 实施重点监控政策前后两种点评药物处方合格率
Tab.2 Rational rate of the prescription of two drugs before and after applying key monitoring policy
月份 2017年 2018年
点评医嘱总例数 问题医嘱例数 处方合格率/% 点评医嘱总例数 问题医嘱例数 处方合格率/%
1月 996 131 86.85 1 575 237 84.95
2月 1 278 202 84.19 979 96 90.19
3月 1 517 236 84.44 1 540 215 86.04
4月 1 447 200 86.18 1 422 126 91.14
5月 1 472 235 84.04 1 235 76 93.85
6月 1 455 242 83.37 1 177 68 94.22
7月 1 505 220 85.38 1 274 108 91.52
8月 1 490 298 80.00 1 201 29 97.58
9月 1 445 257 82.21 1 097 62 94.35
10月 1 484 238 83.96 1 148 57 95.03
11月 1 528 263 82.79 1 145 39 96.59
12月 1 586 279 82.41 1 207 49 95.94
平均 1 433.58±156.05 233.42±43.23 83.82±1.87 1 250±177.86 96.83±66.67 92.62±3.99

表2 实施重点监控政策前后两种点评药物处方合格率

Tab.2 Rational rate of the prescription of two drugs before and after applying key monitoring policy

表3 问题医嘱类型和例数
Tab.3 Types and numbers of irrational medical advice
年月 适应证不适宜 用法用量不适宜 适应证和用法用量 重复用药
% % % %
2017年1月 60 45.80 15 11.45 50 38.17 6 4.58
2017年2月 108 53.47 36 17.82 49 24.26 9 4.46
2017年3月 123 53.12 34 14.41 66 27.97 13 5.51
2017年4月 113 56.50 25 12.50 51 25.50 11 5.50
2017年5月 120 51.06 27 11.49 76 32.34 12 5.11
2017年6月 126 52.07 37 15.29 71 29.34 8 3.31
2017年7月 118 53.64 25 11.36 70 31.82 7 3.18
2017年8月 142 47.65 40 13.42 101 33.89 15 5.03
2017年9月 139 54.09 30 11.67 87 33.85 1 0.39
2017年10月 124 52.10 37 15.55 60 25.21 17 7.14
2017年11月 138 52.47 36 13.69 81 30.80 8 3.04
2017年12月 142 50.90 43 15.41 78 27.96 16 5.73
平均 121.08 51.82 32.08 13.67 70.00 30.09 10.25 4.42
2018年1月 112 47.26 29 12.24 83 35.02 13 5.49
年月 适应证不适宜 用法用量不适宜 适应证和用法用量 重复用药
% % % %
2018年2月 52 54.17 30 31.25 11 11.46 3 3.13
2018年3月 103 47.91 38 17.67 60 27.91 14 6.51
2018年4月 58 46.03 31 24.60 34 26.98 3 2.38
2018年5月 29 38.16 34 44.74 11 14.47 2 2.63
2018年6月 25 36.76 33 48.53 10 14.71 0 0.00
2018年7月 31 28.70 37 34.26 40 37.04 0 0.00
2018年8月 8 27.59 19 65.52 2 6.90 0 0.00
2018年9月 22 35.48 33 53.23 7 11.29 0 0.00
2018年10月 16 28.07 32 56.14 8 14.04 1 1.75
2018年11月 10 25.64 26 66.67 3 7.69 0 0.00
2018年12月 15 30.61 27 55.10 5 10.20 2 4.08
平均 40.08 37.20 30.75 42.50 22.83 18.14 3.45 2.16

表3 问题医嘱类型和例数

Tab.3 Types and numbers of irrational medical advice

2.4 重点监控药品政策对目录内药品使用合理性的影响

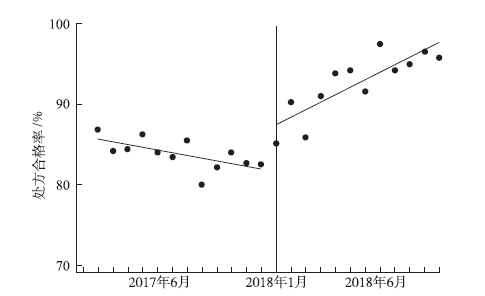
对点评医嘱的处方合格率进行统计分析,结果见图3,模型参数结果见表1。结果表明,①实施重点监控政策干预前重点监控药品使用的处方合格率呈下降趋势,但差异无统计学意义(β1=-0.003 314 7,P=0.053);②实施重点监控政策干预当月,重点监控药品使用的处方合格率显著提高(β2=0.045 766,P=0.009);③实施重点监控政策干预后,重点监控药品使用的处方合格率呈现升高趋势,且差异有统计学意义(β13=0.009 299 2,P=0.000)。

图3 重点监控政策实施前后处方合格率的变化

Fig.3 Change of rational rate of the prescription before and after applying key monitoring policy

3 讨论
3.1 实施重点监控药品政策显著降低监控药品的使用量

实施重点监控政策前监控药品的使用频度呈上升趋势,尤其是2017年11月份,12月份达到最高点。2018年1月份实施后DDDs并未立即大幅下降,但考虑到该月住院人数季节性增长的因素,而且结合另一观测指标重点监控药品金额占比在2018年1月份出现了显著的下降,说明监控药品的使用量较全院其他药品有明显的下降,表明重点监控药品政策在实施当月就对目录内药品的使用产生了预期效果。而且,随着全面深入的实施监控药品的使用量持续下降。从使用频度和使用金额占比两个指标看,重点监控药品政策实施后监控药品的使用量由增长趋势转为下降趋势。

3.2 实施重点监控药品政策减少了监控药品的不合理使用

通过对监控药品中神经节苷脂针和磷酸肌酸针的处方点评可以看到,实施重点监控前存在的主要不合理用药问题为适应证不适宜,其次为用法用量不适宜。实施重点监控后用法用量不适宜问题占比上升,成为主要不合理用药问题。实施重点监控前随着监控药品使用量的增加,不合理用药例数增加,处方合格率下降。实施重点加快后,通过一系列的干预措施,监控药品使用量下降,不合理用药比例随之下降,用药合理性提高,处方合格率逐步提高。

以神经节苷脂针和磷酸肌酸针为例,二者在临床应用广泛,实施重点监控前在我院神经内科、耳科、眼科、心内科、骨科、小儿内科、泌尿外科等科室均有较大使用量。实施重点监控后通过处方点评对相关科室的用药问题及时反馈至处方医师,结合行政干预措施,缺乏循证学依据的用药,如磷酸肌酸在外科常规预防用药 [9]等逐步减少,用药合理性得以提高。

3.3 目前重点监控药品管理中的问题

目前重点监控药品管理中的主要问题为并非从源头管控,难免会顾此失彼。如梁广楷等[10]发现安徽省实施重点监控政策后被监控的奥美拉唑品种用量下降,但未被监控的奥美拉唑品种用量出现显著上升趋势。而过分扩大重点监控药品目录必然增加管理成本。应用药物经济学方法,将成本低、效果好的药物纳入医院用药目录中,对价格昂贵、疗效一般、不良反应多的药品实行淘汰制[11],这样从药品采购源头管控似乎更具成效 [12]

3.4 间断时间序列研究的优势与局限

由于可排除干预前观测指标自身趋势变化的影响,与仅比较干预前后两个时间点的指标或其他横断面研究比较,间断时间序列研究对于干预效果的估计更加可靠。除此之外,间断时间序列研究的优势还体现在不仅可以评估干预措施的即时效果,还可以评估对长期趋势的影响。当然该研究方法的缺点也很明显即需要满足足够的观测时间点,以保证模型的统计效力,这一方面会对研究的时效性产生影响,另一方面势必会增加研究成本。

3.5 研究局限

本研究主要分析了重点监控药品总体的使用量变化,但具体每一个药品的用量变化可能是不同的,后续研究可以具体药品进行详细分析;本研究中处方点评选取了两种药物作为代表,但其他药品可能存在不同的用药问题,随着重点监控政策的实施是否都有所改善还需要进一步研究。
参考文献

[1] 陈冰清,王欣怡,叶桦.我国各省建立重点药品监控制度的比较[J].中国药事,2018,32(10):1314-1321.
[本文引用:1]
[2] 黎赛,盛小燕,梁椅文,.我院重点监控药品管理实践和干预措施探讨[J].中国药房,2018,29(22):3029-3034.
[本文引用:1]
[3] 杨香瑜,张韶辉,郭珩,.基于PDCA循环管理促进医院重点监控药品合理应用[J].医药导报,2018,37(11):1429-1431.
[本文引用:1]
[4] BERNAL J L,CUMMINS S,GASPARRINI A.Interrupted time series regression for the evaluation of public health interventions:a tutorial[J].Int J Epidemiol,2017,46(1):348-355.
Interrupted time series (ITS) analysis is a valuable study design for evaluating the effectiveness of population-level health interventions that have been implemented at a clearly defined point in time. It is increasingly being used to evaluate the effectiveness of interventions ranging from clinical therapy to national public health legislation. Whereas the design shares many properties of regression-based approaches in other epidemiological studies, there are a range of unique features of time series data that require additional methodological considerations. In this tutorial we use a worked example to demonstrate a robust approach to ITS analysis using segmented regression. We begin by describing the design and considering when ITS is an appropriate design choice. We then discuss the essential, yet often omitted, step of proposing the impact model a priori. Subsequently, we demonstrate the approach to statistical analysis including the main segmented regression model. Finally we describe the main methodological issues associated with ITS analysis: over-dispersion of time series data, autocorrelation, adjusting for seasonal trends and controlling for time-varying confounders, and we also outline some of the more complex design adaptations that can be used to strengthen the basic ITS design.
DOI:10.1093/ije/dyw098      PMID:27283160      URL    
[本文引用:1]
[5] LOPEZ BERNAL J,SOUMERAI S,GASPARRINI A.A methodological framework for model selection in interrupted time series studies[J].J Clin Epidemiol,2018,103:82-91.
Interrupted time series (ITS) is a powerful and increasingly popular design for evaluating public health and health service interventions. The design involves analyzing trends in the outcome of interest and estimating the change in trend following an intervention relative to the counterfactual (the expected ongoing trend if the intervention had not occurred). There are two key components to modeling this effect: first, defining the counterfactual; second, defining the type of effect that the intervention is expected to have on the outcome, known as the impact model. The counterfactual is defined by extrapolating the underlying trends observed before the intervention to the postintervention period. In doing this, authors must consider the preintervention period that will be included, any time-varying confounders, whether trends may vary within different subgroups of the population and whether trends are linear or nonlinear. Defining the impact model involves specifying the parameters that model the intervention, including for instance whether to allow for an abrupt level change or a gradual slope change, whether to allow for a lag before any effect on the outcome, whether to allow a transition period during which the intervention is being implemented, and whether a ceiling or floor effect might be expected. Inappropriate model specification can bias the results of an ITS analysis and using a model that is not closely tailored to the intervention or testing multiple models increases the risk of false positives being detected. It is important that authors use substantive knowledge to customize their ITS model a priori to the intervention and outcome under study. Where there is uncertainty in model specification, authors should consider using separate data sources to define the intervention, running limited sensitivity analyses or undertaking initial exploratory studies.
DOI:10.1016/j.jclinepi.2018.05.026      PMID:29885427      URL    
[本文引用:1]
[6] ATC/DDD Index 2021.https://www.whocc.no/atc_ddd_index.
URL    
[本文引用:1]
[7] 陈新谦,金有豫,汤光.新编药物学[M].18版.北京:人民卫生出版社,2018:40.
[本文引用:1]
[8] VALSAMIS E M,RICKETTS D,HUSBAND H,et al.Segmented linear regression models for assessing change in retrospective studies in healthcare[J].Comput Math Methods Med,2019,1-9.
DOI:10.1080/10273660600818264      PMID:21812577      URL    
[本文引用:1]
[9] 袁芳,彭冉,梁虹艺,.外科手术患者围术期磷酸肌酸钠应用评价[J].广东药学院学报,2016,32(5):625-628.
[本文引用:1]
[10] 梁广楷,覃思蓓,李俊蕾, .重点监控药品政策对样本地区质子泵抑制剂使用的影响研究[J].中国医院药学杂志,2018,38(22):2299-2304.
[本文引用:1]
[11] 王笑妍,付秀娟,黄玉鑫,.我院重点监控药品的药事管理模式探索[J].中国药房,2018,29(7):882-885.
[本文引用:1]
[12] 章考飞,凌艺兰,汪峰,.浅谈药剂科对医院不合理用药的药学干预[J].安徽医药,2019,23(2):390-395.
[本文引用:1]
资源
PDF下载数    
RichHTML 浏览数    
摘要点击数    

分享
导出

相关文章:
关键词(key words)
重点监控药品
合理用药
间断时间序列分析
处方点评

Key monitoring drug
Rational use of drug
Interrupted time series
Prescription comment

作者
马晓华
鲁憬莉
康建
杜书章
张晓坚

MA Xiaohua
LU Jingli
KANG Jian
DU Shuzhang
ZHANG Xiaojian