中国科技论文统计源期刊 中文核心期刊
美国《化学文摘》《国际药学文摘》
《乌利希期刊指南》
WHO《西太平洋地区医学索引》来源期刊
日本科学技术振兴机构数据库(JST)
第七届湖北十大名刊提名奖
美国《化学文摘》《国际药学文摘》
《乌利希期刊指南》
WHO《西太平洋地区医学索引》来源期刊
日本科学技术振兴机构数据库(JST)
第七届湖北十大名刊提名奖

 , 罗雪梅
, LUO Xuemei
, 罗雪梅
, LUO Xuemei
目的 评估替加环素致低纤维蛋白原血症是否与浓度有相关性,并确定造成该不良反应发生的浓度阈值。
方法 回顾性分析2019年4月—2021年4月使用替加环素的患者,记录其用药后血药浓度监测结果和用药前后纤维蛋白原值及其他临床指标,按设定的标准将患者分为不良反应(ADR)组49例,对照组74例。分析两组患者替加环素的血药浓度值差异,通过受试者工作特征曲线 (ROC)获得发生ADR的浓度折点。
结果 ADR组和对照组年龄、性别、替加环素剂量、疗程等临床特征均差异无统计学意义;替加环素谷浓度(
Objective To determine the existence of correlation between tigecycline-induced hypofibrinogenemia and concentration, and to define thresholds of toxicity.
Methods Patients received tigecycline from April 2019 to April 2021 were retrospectively analyzed,and the concentration of tigecycline,fibrinogen(FIB)values and other clinical indicators were recorded before and after treatment,and the patients were classified into adverse drug reaction(ADR)group (
开放科学(资源服务)标识码(OSID)
替加环素是甘氨酰环素类抗菌药物,因其耐药率低、抗菌谱广、抗菌活性强,常用于多重耐药菌感染的治疗,且临床常需要超说明书剂量使用[1]。随着替加环素用量的逐年增长,药品不良反应(ADR)也日益增多,尤其是凝血功能障碍对患者预后影响较大,可导致患者因出血等不良事件病情加重,住院时间延长,甚至死亡。其中报道最多的是应用替加环素后导致纤维蛋白原(fibrinogen,FIB)的降低甚至发生了低纤维蛋白原血症[2,3,4]。因此有必要通过临床研究筛选出替加环素引起低纤维蛋白原血症的危险因素,对重点患者进行相应的监测,以减少ADR发生,促进其合理使用。目前国内外对替加环素ADR的研究仍局限在剂量、疗程、患者基础状态等,尚无可靠的指标预测和减少这一类ADR的发生[5,6]。本研究组通过前期替加环素治疗药物监测(therapeutic drug monitoring,TDM)的相关研究发现替加环素体内暴露量可能是很好的预测替加环素致低纤维蛋白原血症的指标。因此本研究拟分析替加环素造成的低纤维蛋白原血症与血药浓度的相关性,并确定造成ADR发生的浓度阈值。
采用单中心回顾性病例对照研究,从南京大学医学院附属鼓楼医院电子病历系统收集2019年4月—2021年4月使用替加环素≥3 d以上的感染患者,记录患者的基本信息,包括性别、年龄、体质量指数(BMI)、原发疾病、感染部位、病原菌、住院时间、替加环素用法用量及用药时长、合并使用其他药物情况(抗凝药、抗菌/抗病毒药物)。记录替加环素治疗前、治疗期间及停药后FIB。记录患者使用替加环素第4天(到达稳态)[1]血药浓度值,包括给药前0.5 h的谷浓度(
ADR判断参考《抗菌药物临床试验技术指导原则》,依据不良反应因果关系 (包括符合药物反应类型、合理的时间顺序、去激发后改善、再激发后重现),判定为肯定、很可能、可能、可以无关、待评价5个等级。当判定为可能、很可能以及肯定时,视作为与药物可能有关,评价为药物的不良反应[8]。参照我院检验值范围及《全国临床检验操作规程》,将FIB<2 g·L-1定义为低纤维蛋白原血症。根据用药期间FIB 检测结果,将入选患者分为ADR组(FIB<2 g·L-1)和对照组(FIB≥2 g·L-1)。
采用SPSS22.0版统计学软件,服从正态分布的计量资料以均数±标准差($\bar{x}±s$)表示,组间对比采用配对
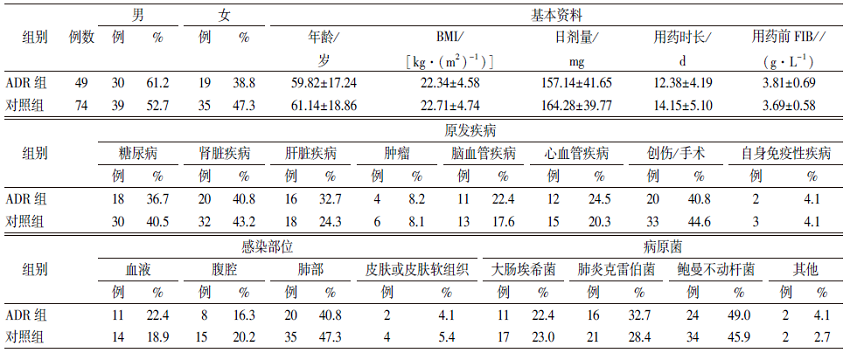
本研究最终共纳入患者123例,按“1.2”项中描述的判定标准将患者分为ADR组和对照组,其中发生ADR的患者49例,占39.8%。从
表1 2组患者的基本资料和一般临床特征
Tab.1 Basic data and general clinical characteristics of two groups of patients $\bar{x}±s$
ADR组和对照组
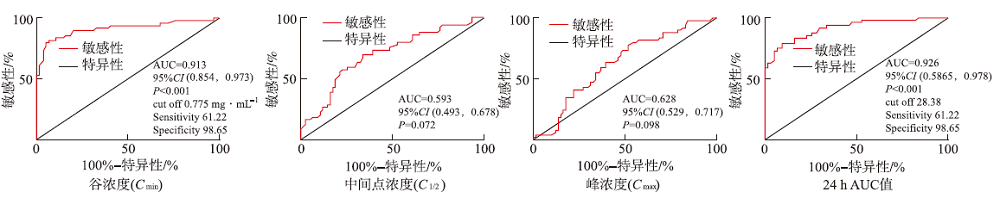
为进一步得出替加环素造成低纤维蛋白原血症的血药浓度折点,将2组浓度数据做ROC曲线分析,见
目前,国内外已有一些研究对替加环素造成凝血功能障碍进行了报道。其中以个案报道居多,指出替加环素会造成患者凝血功能指标的异常,如活化部分凝血活酶时间延长、凝血酶原时间延长、国际标准化比值(INR)升高、血小板减少等,也有许多研究表明替加环素可显著降低FIB水平[2,3,4]。同时,一些临床研究分析了替加环素造成凝血功能障碍的危险因素。其中部分研究表明大剂量使用替加环素(≥150 mg·d-1)、疗程>10 d、基础凝血功能差等是造成凝血功能障碍的主要危险因素[9],但也有其他研究发现替加环素造成的凝血不良反应的发生和剂量、疗程相关性不强[10]。由本研究可以看出替加环素在患者体内的暴露量个体差异很大,可能解释了为什么单一的剂量和疗程无法准确预测替加环素的不良反应,而体内暴露量这一最终表现形式的相关性可能更好。
目前国内外对替加环素血药浓度的研究集中在与疗效的相关性上,已有临床研究发现针对不同的感染部位替加环素的药动学/药效学(PK/PD)下限值,如AUC0-24 h/MIC>6.96(腹腔感染)[11],AUC0-24 h/MIC>17.9(皮肤软组织感染)[12]和AUC0-24 h/MIC>4.5(医院获得性肺炎)[13],但并无研究从安全性角度说明替加环素药动学参数与凝血功能不良反应的关系,即血药浓度参考范围的上限尚不明确。故本研究得出的结论有一定新颖性和应用前景。为避免或减少替加环素造成的低纤维蛋白原血症,其血药浓度参考范围的上限分别为
综上所述,替加环素造成低纤维蛋白原血症的血药浓度折点为
| [1] |
|
| [2] |
|
| [3] |
|
| [4] |
|
| [5] |
|
| [6] |
|
| [7] |
|
| [8] |
|
| [9] |
|
| [10] |
|
| [11] |
Exposure-response analyses were performed to test the microbiological and clinical efficacies of tigecycline in complicated intra-abdominal infections where Escherichia coli and Bacteroides fragilis are the predominant pathogens. Data from evaluable patients enrolled in three clinical trials were pooled. Patients received intravenous tigecycline (100-mg loading dose followed by 50 mg every 12 h or 50-mg loading dose followed by 25 mg every 12 h). At the test-of-cure visit, microbiological and clinical responses were evaluated. Patients were prospectively classified into cohorts based on infection with a baseline pathogen(s): E. coli only (cohort 1), other mono- or polymicrobial Enterobacteriaceae (cohort 2), at least one Enterobacteriaceae pathogen plus an anaerobe(s) (cohort 3), at least one Enterobacteriaceae pathogen plus a gram-positive pathogen(s) (cohort 4), and all other pathogens (cohort 5). The cohorts were prospectively combined to increase sample size. Logistic regression was used to evaluate ratio of steady-state 24-hour area under the concentration-time curve (AUC) to MIC as a response predictor, and classification-and-regression-tree (CART) analyses were utilized to determine AUC/MIC breakpoints. Analysis began with cohorts 1, 2, and 3 pooled, which included 71 patients, with 106 pathogens. The small sample size precluded evaluation of cohorts 1 (34 patients, 35 E. coli pathogens) and 2 (16 patients, 24 Enterobacteriaceae). CART analyses identified a significant AUC/MIC breakpoint of 6.96 for microbiological and clinical responses (P values of 0.0004 and 0.399, respectively). The continuous AUC/MIC ratio was also borderline predictive of microbiological response (P = 0.0568). Cohort 4 (21 patients, 50 pathogens) was evaluated separately; however, an exposure-response relationship was not detected; cohort 5 (31 patients, 60 pathogens) was not evaluated. The prospective approach of creating homogenous populations of pathogens was critical for identifying exposure-response relationships in complicated intra-abdominal infections.
DOI:10.1128/AAC.00813-07
PMID:17954694
[本文引用:1]
|
| [12] |
|
| [13] |
Pharmacokinetic and clinical data from tigecycline-treated patients with hospital-acquired pneumonia (HAP) who were enrolled in a phase 3 clinical trial were integrated in order to evaluate pharmacokinetic-pharmacodynamic (PK-PD) relationships for efficacy. Univariable and multivariable analyses were conducted to identify factors associated with clinical and microbiological responses, based on data from 61 evaluable HAP patients who received tigecycline intravenously as a 100-mg loading dose followed by 50 mg every 12 h for a minimum of 7 days and for whom there were adequate clinical, pharmacokinetic, and response data. The final multivariable logistic regression model for clinical response contained albumin and the ratio of the free-drug area under the concentration-time curve from 0 to 24 h (fAUC(0-24)) to the MIC (fAUC(0-24):MIC ratio). The odds of clinical success were 13.0 times higher for every 1-g/dl increase in albumin (P < 0.001) and 8.42 times higher for patients with fAUC(0-24):MIC ratios of ≥0.9 compared to patients with fAUC(0-24):MIC ratios of <0.9 (P = 0.008). Average model-estimated probabilities of clinical success for the albumin/fAUC(0-24):MIC ratio combinations of <2.6/<0.9, <2.6/≥0.9, ≥2.6/<0.9, and ≥2.6/≥0.9 were 0.21, 0.57, 0.64, and 0.93, respectively. For microbiological response, the final model contained albumin and ventilator-associated pneumonia (VAP) status. The odds of microbiological success were 21.0 times higher for every 1-g/dl increase in albumin (P < 0.001) and 8.59 times higher for patients without VAP compared to those with VAP (P = 0.003). Among the remaining variables evaluated, the MIC had the greatest statistical significance, an observation which was not surprising given the differences in MIC distributions between VAP and non-VAP patients (MIC(50)and MIC(90) values of 0.5 and 0.25 mg/liter versus 16 and 1 mg/liter for VAP versus non-VAP patients, respectively; P = 0.006). These findings demonstrated the impact of pharmacological and patient-specific factors on the clinical and microbiological responses.
DOI:10.1128/AAC.01615-10
PMID:22143524
[本文引用:1]
|
